How to create indoor navigation maps has been written by Adrian Canedo, CTO at Situm – PhD Robotics
1. Indoor Maps and indoor navigation
Indoor maps are connected to a previous post in which we talked about one of the most important ingredients that an indoor navigation app must have: a good indoor positioning system. For the lazy ones, good indoor positioning systems:
- Are accurate (1-5 meters is enough).
- Provide frequent and stable location updates (one per second, not jumpy…).
- Detect the floor where you are automatically and work with the smartphone in the hand or in the pocket.
Oh! And they do all that without requiring huge infrastructure investments. To do so, they usually rely on all the smartphone sensors to use whatever sensor information is available (WiFi signals, BLE readings, inertial sensors…).
But just as a crunchy base alone doesn’t make a great pizza, you can’t build a great Indoor Navigation app relying only on an indoor location system. You also need to build a great user navigation experience, and to this end you must add two toppings into the mix: Indoor Maps and Indoor Routes.
2. Indoor Maps & Indoor Cartography
An indoor location system will provide information such as: “The user is in building 1234, in floor 4567, at coordinates 42.875813-8.535442 and orientation 94º with respect to the North”. No user wouldn’t know what to do with this information: here is where indoor cartography can help. You can display all the floors and the user location in each exact location within nicely designed indoor maps. You can also build a search bar where the user can look for points of interest (e.g. a shop in a shopping mall or a doctor’s office in a hospital). And you can even display the shortest route to the destination with turn-by-turn navigation indications (more on this later)!
When we talk about indoor maps, we usually refer to the whole building cartography: typically floorplans, points of interest and geofences.
2.1 Floorplans
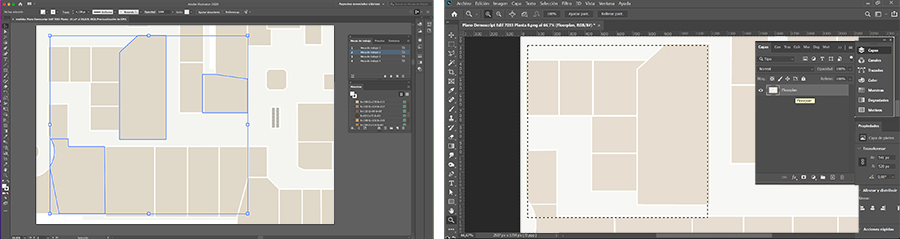
Floorplans are the most important element. They provide a visual representation of each floor, allowing the user to know where he is and also to view all the building details at a glance. Most venues have readily available drawings of their building in CAD or PDF files. These drawings are not very user friendly, so you’ll probably need to design your own (nice & visually attractive) floorplans based on them. To this extent, you may use something as simple as your own favourite digital design tool (such as Photoshop or Inkscape), or as complex as a Building Information Modelling software. There are two main approaches when designing & maintaining the floorplans of a building.
Raster floorplans (plain images)
Floorplans can be represented using raster files, typically PNG/JPEG files, or more advanced formats like GeoTIFF, JPEG 2000, etc. In essence, raster files are plain images or bitmaps, basically arrays of pixels whose values represent certain locations of the indoor space.
The easier way of generating these floorplans is by exporting the building drawings from their original CAD, or Illustrator / PDF files to an image format. Usually, you will want to edit them using your favourite image editor (e.g. Photoshop or Inkscape) to provide a nice floorplan view to your users.
You may insert these images directly in your apps & work with them as bitmaps. Another way of dealing with the floorplan representation in your app would be to use a basemap provider, such as Google Maps or Mapbox .

To overlay your floorplans on top of a basemap, you will need to georreference them. This is where cartography platforms such as Situm come in handy: you can upload & georreference your floorplans easily and the APIs & SDKs will provide all this information for you to integrate & display (without dealing with complex cartographic concepts).
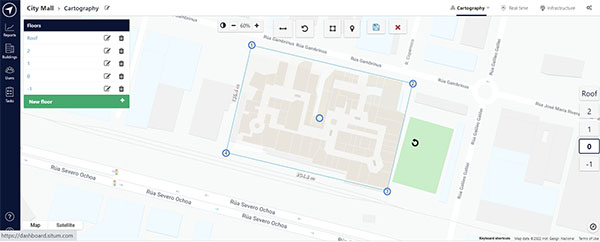
If you want to manage large buildings (e.g. more than 500 meter long), a simple raster image will not cut it: in order to provide a decent detail level, you would need floorplan resolutions larger than 4096×4096. At higher resolutions, your mobile app may become unresponsive. One common approach is to use raster tiles, which split a high resolution image into small chunks, and then serve & display each tile independently in the application. Situm is also compatible with this approach, making it possible to display huge buildings without losing resolution.
For those who need more advanced capabilities (e.g. importing/exporting automatically cartography formats such as CAD or GeoTIFF, multiple raster layers per floor, compatibility with a long list of OGC formats & cartography standards, etc.), taking a look at providers such as Carto or Esri may be worth it. There are also nice open source alternatives such as Mapserver or Geoserver, and if you really know your way around, you may also build your own custom-made-solution with PostGIS + QGIS. Either way, Situm’s indoor location & SDKs will integrate nicely.
Vector floorplans
We’ve seen that raster floorplans divide the space into an array of small areas (pixels), and represent the building elements by the value of those pixels. This approach is easy, efficient, integrates well with any mobile & web app, and allows to represent all sorts of indoor spaces, from small to huge buildings (where raster tiles come to the rescue!).
However, there are some situations where raster floorplans might not be the most sensible choice. To name just a few:
- Your floorplan images are really big. You have increased the raster resolution (and even used raster tiles) but you can still notice those little pixels and you don’t like them.
- You want the user to interact with your cartography elements. Maybe you want to change the color of a shop when the user clicks on its area, or display a text whose zoom level & rotation varies according to the user gestures, etc.
- You want to display / hide / style certain cartography elements dynamically, depending on pre-defined conditions, the user interaction or your own application’s logic. A common requirement in this regard is to provide a 3D view by extruding cartography elements.
Here is where vector floorplans’ increased complexity pays off. Vector floorplans are nothing but a set of 2D/3D mathematical representations of geometrical shapes. Instead of drawing a doctor’s office on a plain image, we define it’s geometry (e.g. a rectangle) mathematically and just render it at runtime! Some popular vector formats are GeoJSON, IMDF or Mapbox Vector Tiles.
Properties such as resolution, color or intensity are not necesarily hardcoded in the vector information, so we can change them on the fly. We can display the doctor’s office at any given resolution, modify its colour from gray to brown, and even extrude it to achieve a 3D view. We can also detect easily the user’s interactions with those elements and act accordingly. And all this without modifying the original information!
Of course, there are disadvantages as well. Vector floorplans are harder to generate and maintain. While raster maps can be virtually generated by anyone who can edit an image, vector floorplans required specialized tools (e.g. QGIS) and a bit of cartography knowledge. Moreover, if your building is large and has lots of cartography features, vector floorplans’s size may grow disproportionatelly, consuming lots of your user’s mobile data (ouch!). Luckily, some formats also support vector tiles (e.g. Mapbox Vector Tiles), which alleviate this last issue.
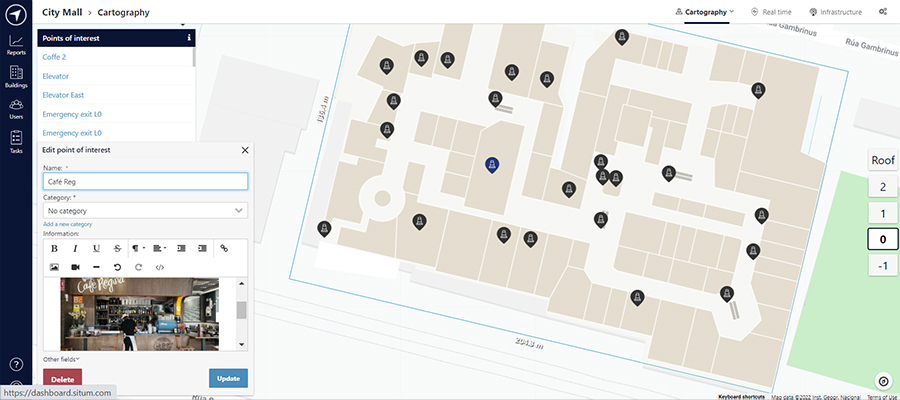
2.2. Points of interest
Floorplans are the central part of every building’s cartography, but other elements are important as well! One of these elements is Points of Interest (POIs).
POIs are nothing but important places within the venue. They can be a doctor’s office, a boarding gate, or just a vending machine. Points of interest are important because your users will want to find them, retrieve their information and know how to get to them.
If you are using raster maps, one approach to represent POIs is to just “draw” them on top of the floorplans. This is an easy-enough approach, although the results will be far from ideal (e.g. you will need to re-draw the floorplan if just one POI changes). A better approach is to use a cartography platform such as Situm, which allows you to create/edit POIs from a web interface on top of your floorplans, and also associate information to them (e.g. their name, category, customized icon and much more). After that, your POIs will be served through APIs & SDKs so you can integrate them easily into your apps.
If you are using vector maps, you may also be able to define POIs as elements of those maps, since POIs are essentially points with associated information. The specifics on how to do this depend on the format you choose.
2.3 Geofences
Geofences are the last important bit of information. They are similar to POIs in that they represent elements of the building (e.g. a shop in a shopping mall or the hall of a hospital), but they differ because geofences are polygons, therefore they represent areas (not just specific points).
Geofences are useful because working with areas is useful. For example, you may want to highlight a certain area of your venue, send a geopromotion to an user that walks inside it or even compute geoanalytics based on them (e.g. number of users per geofence to check the current capacity).
 | 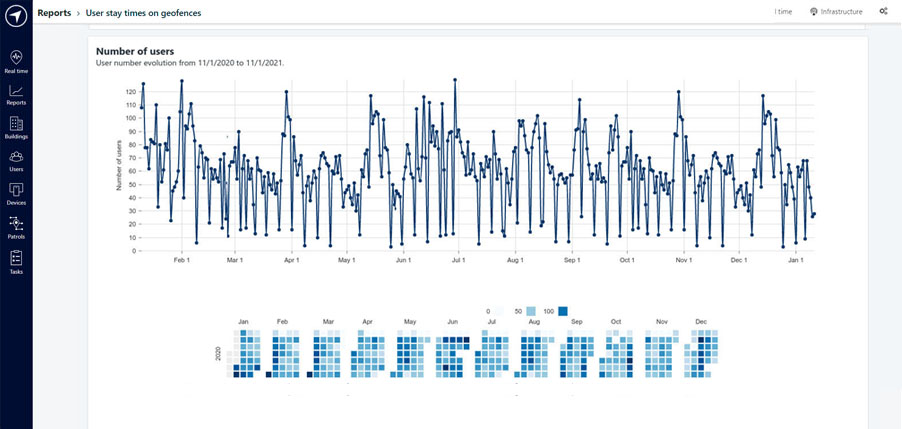 |
Figure 5. Geofences are useful for geopromotions and geoanalytics of a specific area
One way to define & use geofences is to leverage on an indoor maps and cartography platform such as Situm. With Situm, you can define your geofences on top of your floorplans through a simple web interface. After that, you can operate these geofences easily into your app using our REST APIs and mobile SDKs.
Another common way to define geofences is to treat them as areas within your vector maps (in case you are using them). An useful approach, for example, is to define the different areas of the environment using a vector maps tool (e.g. QGIS) and associate information with those areas.
3. Indoor Routes & Indications
At this point, your application will have indoor maps with floorplans, points of interest and geofences. Hopefully, it will have geolocation too! But this is not enough: to provide a complete wayfinding experience, you will need routes and turn-by-turn indications.
3.1 Routes
Routes are paths that connect an origin with a destination. The origin is usually the user’s geolocation, and the destination is any point of interest or geofence where the user wants to go.
In order to compute routes in your app, you will need to know the passable space in your building. There are two common approaches:
- One way is to define passable and not passable areas in your floorplan (e.g using an array of 0s and 1s)
- Another one is to create a wayfinding graph, a set of nodes and links that represent all the passable paths of the building, and therefore all the possible routes.
Either way, in order to compute the shortest route you’ll need to implement algorithms such as Dijkstra or A*.
Luckily, platforms such as Situm make this a breeze. In Situm you can just “click & connect the dots” on Situm Dashboard to create your wayfinding graph.
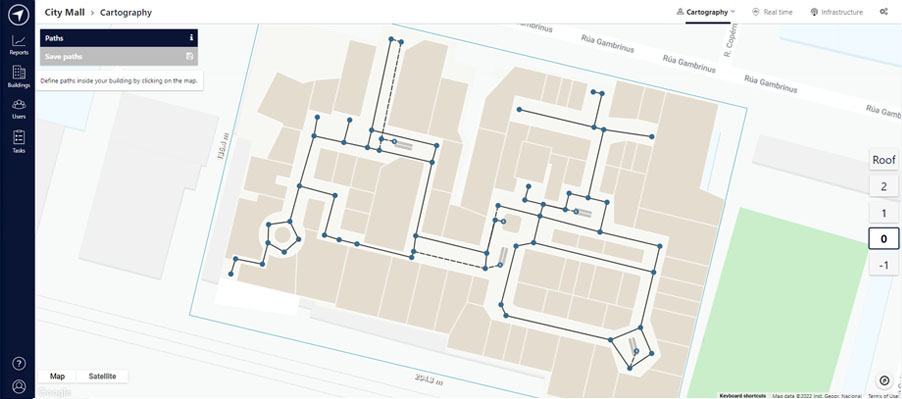
Figure 6. Indoor map with “click & connect the dors” paths for indoor navigation on Situm Dashboard.
Then, you can leverage on Situm SDKs to compute the shortest route without coding the routing algorithms yourself. Not only that, Situm allows you to compute special routes, such as routes adapted to people with reduce mobility, routes that minimize the number of floor changes, or routes that avoid paths of a certain type (e.g. paths tagged as “private” might be avoided if the user can not access private areas of the building). All you have to do is displaying the computed route on top of your floorplan!
While the user moves, you will need to update your UX: display how the user advances in the route (e.g. by not displaying the parts the user has covered already), re-compute the route if the user goes “out-of-route”, update the floorplan view in case the user changes floors, etc. Situm SDK carries most of this weight, so you can focus on your app.
3.2 Indications
Displaying a route is great, but there’s another important element to wayfinding apps: Turn by turn indications. Turn by turn indications are messages that inform the user on how to get to the destination, and the series of steps or actions he should perfom (e.g. “go ahead for 40 meters; then go to the second floor; then turn right and go ahead for 50 meters, etc.”).
If you think about it, a route is nothing but a set of displacements (straight lines) that the user has to follow. Indications just translate those displacements to human language. But… this translation is not an easy task. You need to:
- Define & extract the set of actions and modifiers that the user should perform. You will need to compute walking distances, floor changes, and orientation changes by the angle between consecutive path lines. Some examples are:
- Go ahead (action) for 100 meters (modifier).
- Turn (action) to your left (modifier).
- Show the appropriate action & modifier to the user at every moment, taking into account his current position and orientation. Routes are not static! So you will need to be constantly updating the current indication as the user advances or turns.
- For example, the current indication may be “Go ahead for 100 meters”. But if the user stops and turns around, you must “insert” a new dynamic indication “Turn around” before the user can continue with the “Go ahead” indication.

Again, platforms such as Situm make all this a no-brainer. Situm, defines three main actions (turn, go ahead, change floor) and 2 modifyers (orientation and distance). It provides all the indications for a given route, and it also provides constant updates taking into account the user location & orientation (and even re-computes the whole route if necessary!).
And if you want to put the icing on the cake, you can play the indications aloud using Android’s or iOS text-to-speech capabilities. In just a few lines of code, you will enable your app to provide indoor wayfinding for visually impaired users as well!
4. Putting everything together into a great indoor navigation UX with indoor maps
Geolocation, indoor maps and routes are the ingredients required to build navigation app. But the real difference between a great app and a bad one is the User Experience. You will need to combine these elements to implement your use cases in a way your user expects & understands. Although this changes from app to app, we recommend you to take a look at how our app Situm Mapping Tool works. You are free to take inspiration from our designs and interactions or even integrate this same UX in a few lines of code using our Wayfinding Module.