Situm’s polygonal geofencing tool is a great ally for the managers of large buildings. Because of the possibility of easily delimiting polygonal areas, it allows greater control over the facilities and work processes, the development of geomarketing actions and obtaining analytics. And it is indeed the geofences reports the latest focus of our improvements, as we have expanded and improved them aesthetically to make them easier to understand at the same time as being more functional.
The polygonal geofence is a very useful feature for the managers of large buildings who already work with us. By being able to delimit specific spaces in which to geolocate users (visitors or work teams), we can also gather more precise analytics: about a specific corridor, a store in a shopping mall or any other area of the facility that is relevant. The greater the knowledge, the greater the control over spaces and work processes.
Until now, this tool, whose functionality is very precise, made it possible to calculate the total time that a user (or several) had been inside a geofence. However, the geofences reports initially had some limitations:
- The time range was limited to one month.
- Each report was limited to a single geofence. If you needed to compute the time range in more than one geofence, you had to generate several independent reports.
- It displayed the results only in a table format which, although functional, was not very visual.
More complete and visual geofence stay reports
To extend these features and remove further obstacles when extracting information, we have added new functionalities:
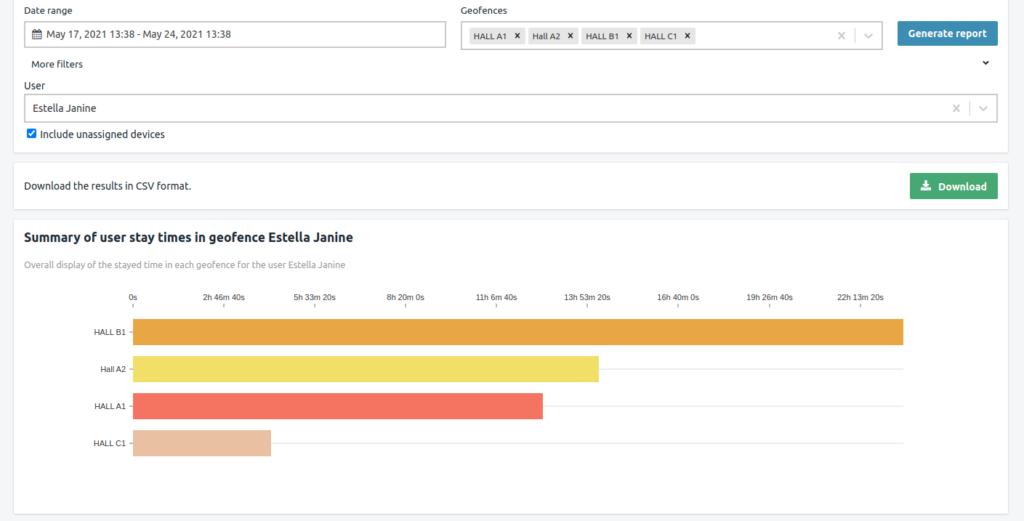
- Data can now be selected over wider time ranges, up to a maximum of one year.
- Selecting one, several or all the geofences of one or several buildings and obtaining their stats.
- Finally, we have added a user search engine to find out how long a worker or vehicle has been in a particular geofence.

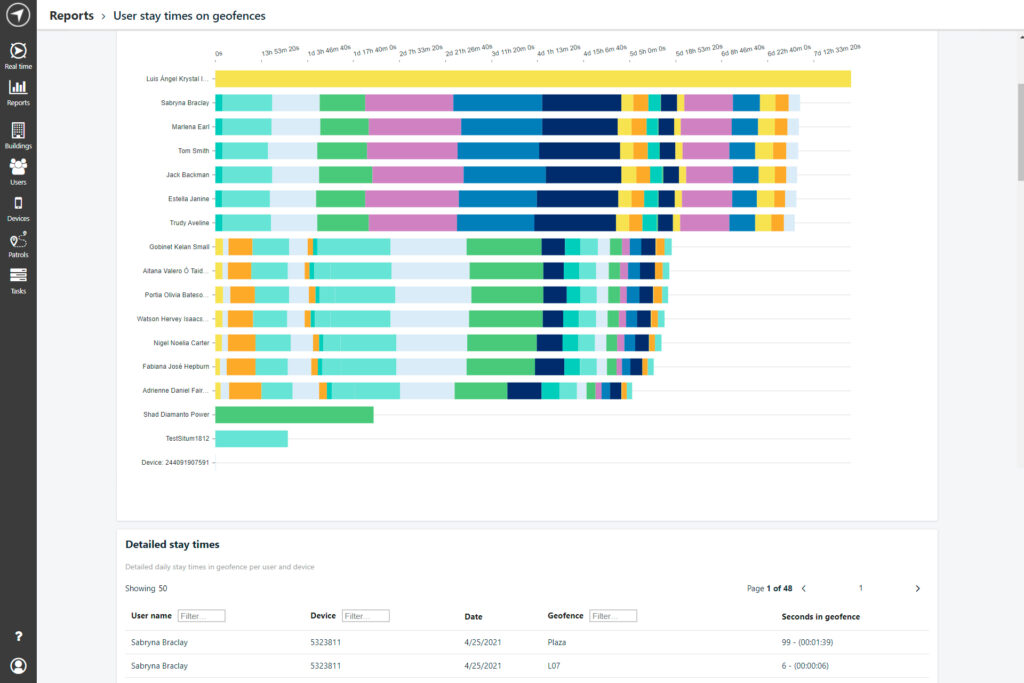
To facilitate the interpretation of these results in a more visual way, we have incorporated a chart. Through bars and colours, a single screen summarizes the time spent by each user in the selected geofences.
And if we select a specific user, we can also break down the time spent in each of the geofences.
However, these improvements do not eliminate the table we already use but extend it with dynamic filters (user name, device and geofence). Its organization is easier now with manageable rows and results by pages, which also speeds up the loading time.

If you want to learn more about the use of geofences to obtain analytics on the activity of work teams, and how they can benefit the productivity of your business, do not hesitate to contact us.
