Situm’s Dashboard allows the platform manager to access all the buildings in their account in order to monitor the activities carried out by the different devices or users that may operate in them (security guards, maintenance, cleaning, etc.)
This section is accessible through the menu on the left in the global overview of your account. This Reports module gives information about the use of building, heatmap, user stay times on geofences, trajectories visualization, location history, location history on map, alarms and patrols.

Use of building #
These reports allow checking the number of users that have been positioned on each building or floor. You may use this report to:
- Have an idea of the total number of visitors in your building who are using the indoor and/or outdoor positioning service.
- Verify how many members of your staff (like security guards, cleaners, maintenance in general) have been providing a service, in a certain building, at a certain time.
Once in Reports (1), we go to the Usage reports section: How the users interact and use the building? (2) and then go to Use of building: Positioning data of users in the building (3).

Once inside the report, we have 3 mandatory selector filters:
- Date range (1): Select a day for daily detail or a larger range for multi-day tracking.
- Building (2): You will be able to select the building you want to get the heatmap from without having to go straight into the building.
- Floor (3): Select all floors or a specific one.
Once covered, click on generate the report (4) and two types of reports will be displayed. You can also download a CSV with the raw data (5).

Two types of reports displayed are:
- Number of users:
a) Linear graph indicating the evolution of users in selected period.
b) Chart of monthly symbols grouped by the months of the year.

c) Visit durations by week day: It is used to find out which days of the week users visit the building for the longest time on average.

Heatmap #
The heatmap report is a graphical representation of the data using colors to indicate the level of activity.
Heatmaps are very valuable as they provide information about which exact points are the most visited, user behavior patterns or at a glance to see if a user has passed through a specific area.
To get the user location density report through the dashboard you can either click on Reports on the menu on the left in the global overview of your account. Then select Heatmap (2) on the Stay Reports section (1).

This report has different options among which are:
Mandatory options:
- Date range (1): Period in which you want to create the graph (date and time).
- Building (2): You will be able to select the building you want to get the heatmap from without having to go straight into the building.
- Floor (3): You can see all the floors without having to generate the Heatmap again.
- Include outdoor positions (4): Switch the button in which we can see the outdoor positions (if they are enabled).

More filters:
- User (5): Filtered by a single user
- Device (6): Filtered by a single device
In the different dropdowns, if there is data, the green dot will appear next to it.
In addition, with the crtl key + left mouse click, we can move the orientation map.

As shown in the image above, you will be able to adapt the report to your needs:

- Select the color gradient of your choice from a list of four different ones.
- Change the Radius, Opacity and Intensity of the Heatmap.
- Toggle between floors without having to regenerate the report. The data will be stored in caché.
- Enable the 3D view, which will make your report very pleasant to look at!
- Hovering over each section will give you the number of positions calculated in that specific area
- In the 3D view, you may filter data on show/hide hexagons by positions in order to change the weight of the positions on each bar graph.

Trajectories #
Allows identifying the routes covered by any user or device during a specific period, both indoors and outdoors as well as providing data on the distance traveled by each of them. A moving icon allows you to see where the user was on a second-to-second basis, therefore easily identifying its movements with great granularity. Some sample use cases:
- Demonstrate that a certain member of your staff was at his post when an incident happened (e.g. to avoid a penalty).
- Audit your staff’s patrols.
Once in Reports (1), we go to the Displacement Reports section: How users are moving? (2) and then go to Trayectories Visualization: Trajectories view performed by device in the building (3).

Once inside the report, we will have some options similar to the other reports:
- Date range (1): The maximum range is 24h.
- Building (2): You will be able to select the building you want to get the heatmap from without having to go straight into the building.
- Group (3): It’s not a mandatory field (you could have it disabled at the organization level), it is used in buildings with many users
- User (4)
- Device (5): Select one of the devices that have used the same account.

Once in the trajectory viewer, we have 2 menus at our disposal:
- Summary and control (A): In this menu, you can see:
- User.
- Distance travelled in the period that you have selected.
- Current plant in the hour and minute marked in the selector.
- Avoid positioning jumps: If the positioning presents any jump you could filter it.
- Time selector (B): In this menu you have:
- Play and pause selector.
- Control speed.
- Delimit the beginning and end of the trajectory.
- Zoom selected range.

Location History #
This report complements the previous one: it tells you the buildings and geofences through which an user has passed in a certain time period. In a way, it’s like having a text description of an user’s trajectory/movement.
Once in Reports (1), we go to the Displacement Reports section: How users are moving? (2) and then go to Location history: Chronology of checkpoints some user has passed. (3).

Once inside this report, select a single day in the Date range field (1) and a single user in the User Field (2). In addition to this, you can download a CSV (3) with the data you have filtered.

Visits and Stay times on geofences #
Allows you to check the behavior of your staff/visitors in your building’s geofences. Some useful use cases are:
- Have a clear picture of the most popular areas in your building.
- Review that your staff has been cleaning all areas evenly (or according to your planning).
- Demonstrate that your security staff has been surveilling certain areas as they should have.
To do this, click on the left panel Reports (1) and go to the section Stay reports (2) -> Visits and stay times on geofences (3)

The report has two different modes: stay times and visits
Stay times in Geofences #
Using this report you will get a detailed overview of time spent by users/devices in all the geofences you have selected. You can use the next filters:
- Date range: Select one or several days.
- Geofence: Select All, several or one Geofence.
- Users: Select All, several or one Geofence.
- Stay times: Select it to see the Summary of user stay times in geofence
- You can group results by user/device or by a geofence.


Also if you scroll down, both reports have Detailed stay times. You also have the option to download the data in CSV.

Stay times in Geofences #
The visits to geofences mode (1) allow you to track which device/user has passed through each geofence. It contains a useful graph that will summarize all the visits in a timeline, and for more detailed information it contains a table where you can check all the visits and all their information.

This report has a details in which you can see the entry and exit of each geofence (1). You also have the option to download raw data (2).

Alarms #
Situm stores each alarm generated with its geolocation. The alarms report allows us to retrieve this information, filtering it by many parameters (building, user, alarm type, etc.). This way, we may check past alarms for auditing purposes.
Once in Reports (1), we go to the Other reports section: Other reports specifics for some functionality (2) and then go to Alarms: Historial relation of alarms sent by users (3).

In this section, you can see the list of all alarms or filters using the following parameters:
- Date range: Select from one day to a maximum of 30 days.
- Building: One or All.
- User: One or All.
- Alarm type: In this tab we can filter the following alarms:
- SOS Alarm: Alarms manually triggered by the user via mobile App.
- Deadman: Are generated when the terminal measures a sudden drop in height.
- Non-compliance: Are generated when a user does not comply with his or her patrol.
- Immobility Alert: Are generated when the terminal does not detect motion for a certain period of time.
- Stationary Alarm: Maximum time spent in geofence. More info.
- Attended: Yes or No.
In addition, you can also download a CSV (6):

Patrols #
To analyze the compliance or performance data of the rounds carried out, we will use the Reports panel. To do this, click on the left panel reports and go to the section Other reports (1) -> Patrols (2)

After this, we access the breakdown with the round compliance data. The different data visualizations allow us to audit the activities/actions carried out.
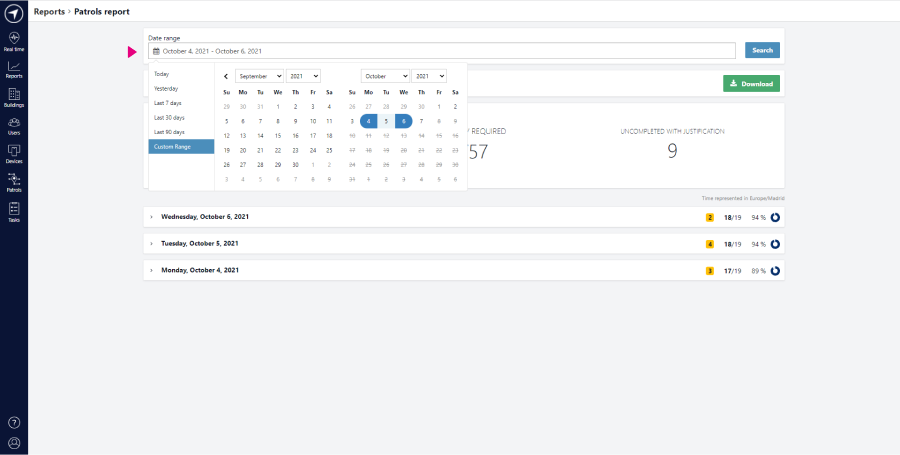
To do this, we first select the date or range of dates that we want to analyze and we give it a search. An analytical and statistical screen will appear, shown below:
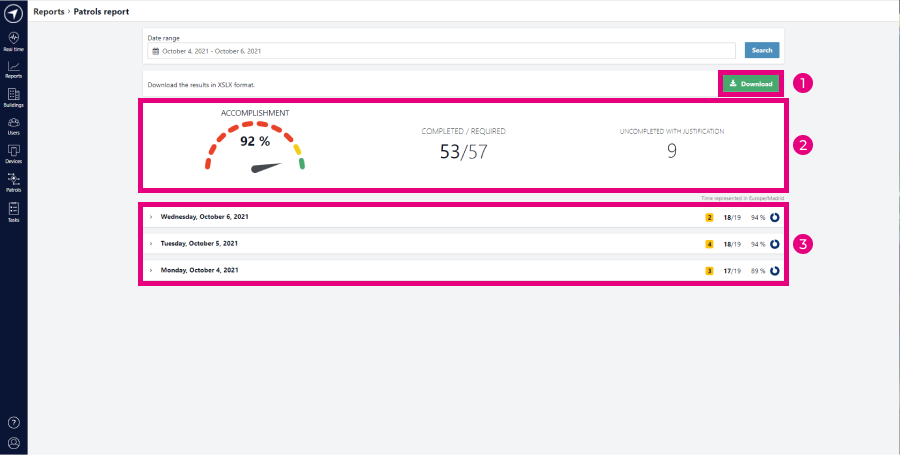
3 sections will appear:
- The option to download a .xslx by pressing the Download button
- In this subsection, we have a graph indicating the percentage of completion, a ratio of rounds Completed / Required and the number of rounds incomplete with justification (discussed later).
- Dropdown menus with the dates we have searched for.
Detailed report of daily patrols #
If we click on the dropdown menus of the previous capture (3), a list will appear with all the rounds that have to be carried out on that day.

At the top right, we see a summary of uncompleted rounds with justification (yellow background), accomplished patrols / required patrols, and accomplishment percentage.
Next, we will explain the types of rounds that appear in this report:
- Required patrols: Daily rounds that are assigned to users who have to perform them daily
- Accomplished patrols: Rounds completed successfully
- Uncompleted: Rounds that have been started, but have not been completed correctly
- Uncompleted with Justification: Rounds that have not been completed correctly, but a reason has been added to indicate the reason for not completing them.
- Accomplishment percentage: Follow the formula of (Required Rounds / (Complete Rounds + Incomplete + Incomplete with Justification)) * 100
Also, if we want to see the details of each round individually, by clicking on it, the following information will appear:

In it we see the following data:
- User: Who has made the round
- Start: Round start time
- End: Round end time
- Status: Result of the completion of the round
 : This button takes us to the detail of execution per round.

In this detail, we see a linear schedule with all the information collected by the user, both the one entered by him and the capture of checkpoints as he passes through them:
- Round started: The name of the round and its start time is indicated
- User annotation: Incidents that the user collects during the completion of the round
- Manual step: Checkpoint manually booked
- Round Justification: Reason why the round has not been completed
- Round End: Name of the round and end time.
- Indoor: Building where the user is located
- Outdoors: Coordinates that indicate the user’s outdoor position
Note: However, if you aren’t able to see these filters, it may be possible that the feature is not active for your account. Please, contact support@situm.com to have it activated.

